Data projects
This page is dedicated to some of my data logging projects. I will present (and if I feel
that I have useful background information) and discuss the logged data.
Oscilloscope data
Recently I acquired an oscilloscope with the capability of sending the waveform data to a computer over GPIB.
Thus, I wrote some code to acquire and process this data, after which I started recording stuff. One of the first
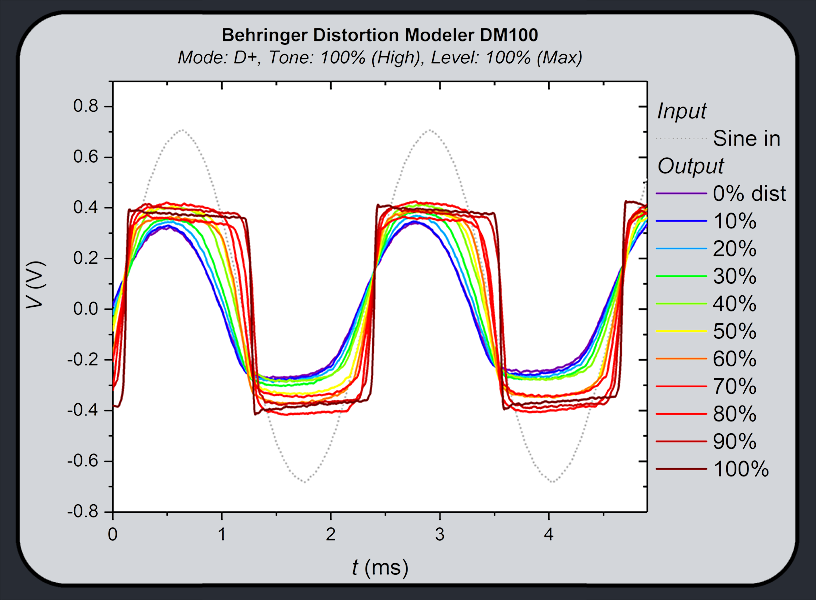
things that I tested was my Behringer DM100 distortion pedal. The waveform data is shown below. Click on the figure
to obtain a high-res PDF version.
Due to the lack of having enough BNC cables, the triggering of the data was difficult and therefore the data is not
perfectly aligned with respect to time (I might redo the measurement after receiving the ordered cables). The input
is a 440 Hz sine wave (from a function generator). The output shows the distorted signal, which is of the diode-clipping
type (for some theory, check
this webpage).
Temperature history of 2017
As a project to get familiar with data logging, I monitored my room temperature using a DHT sensor
and an Arduino. Soon, I wanted to compare this data with outdoor temperature data, so I wrote some
code to obtain data from
Weerstation Haaksbergen.
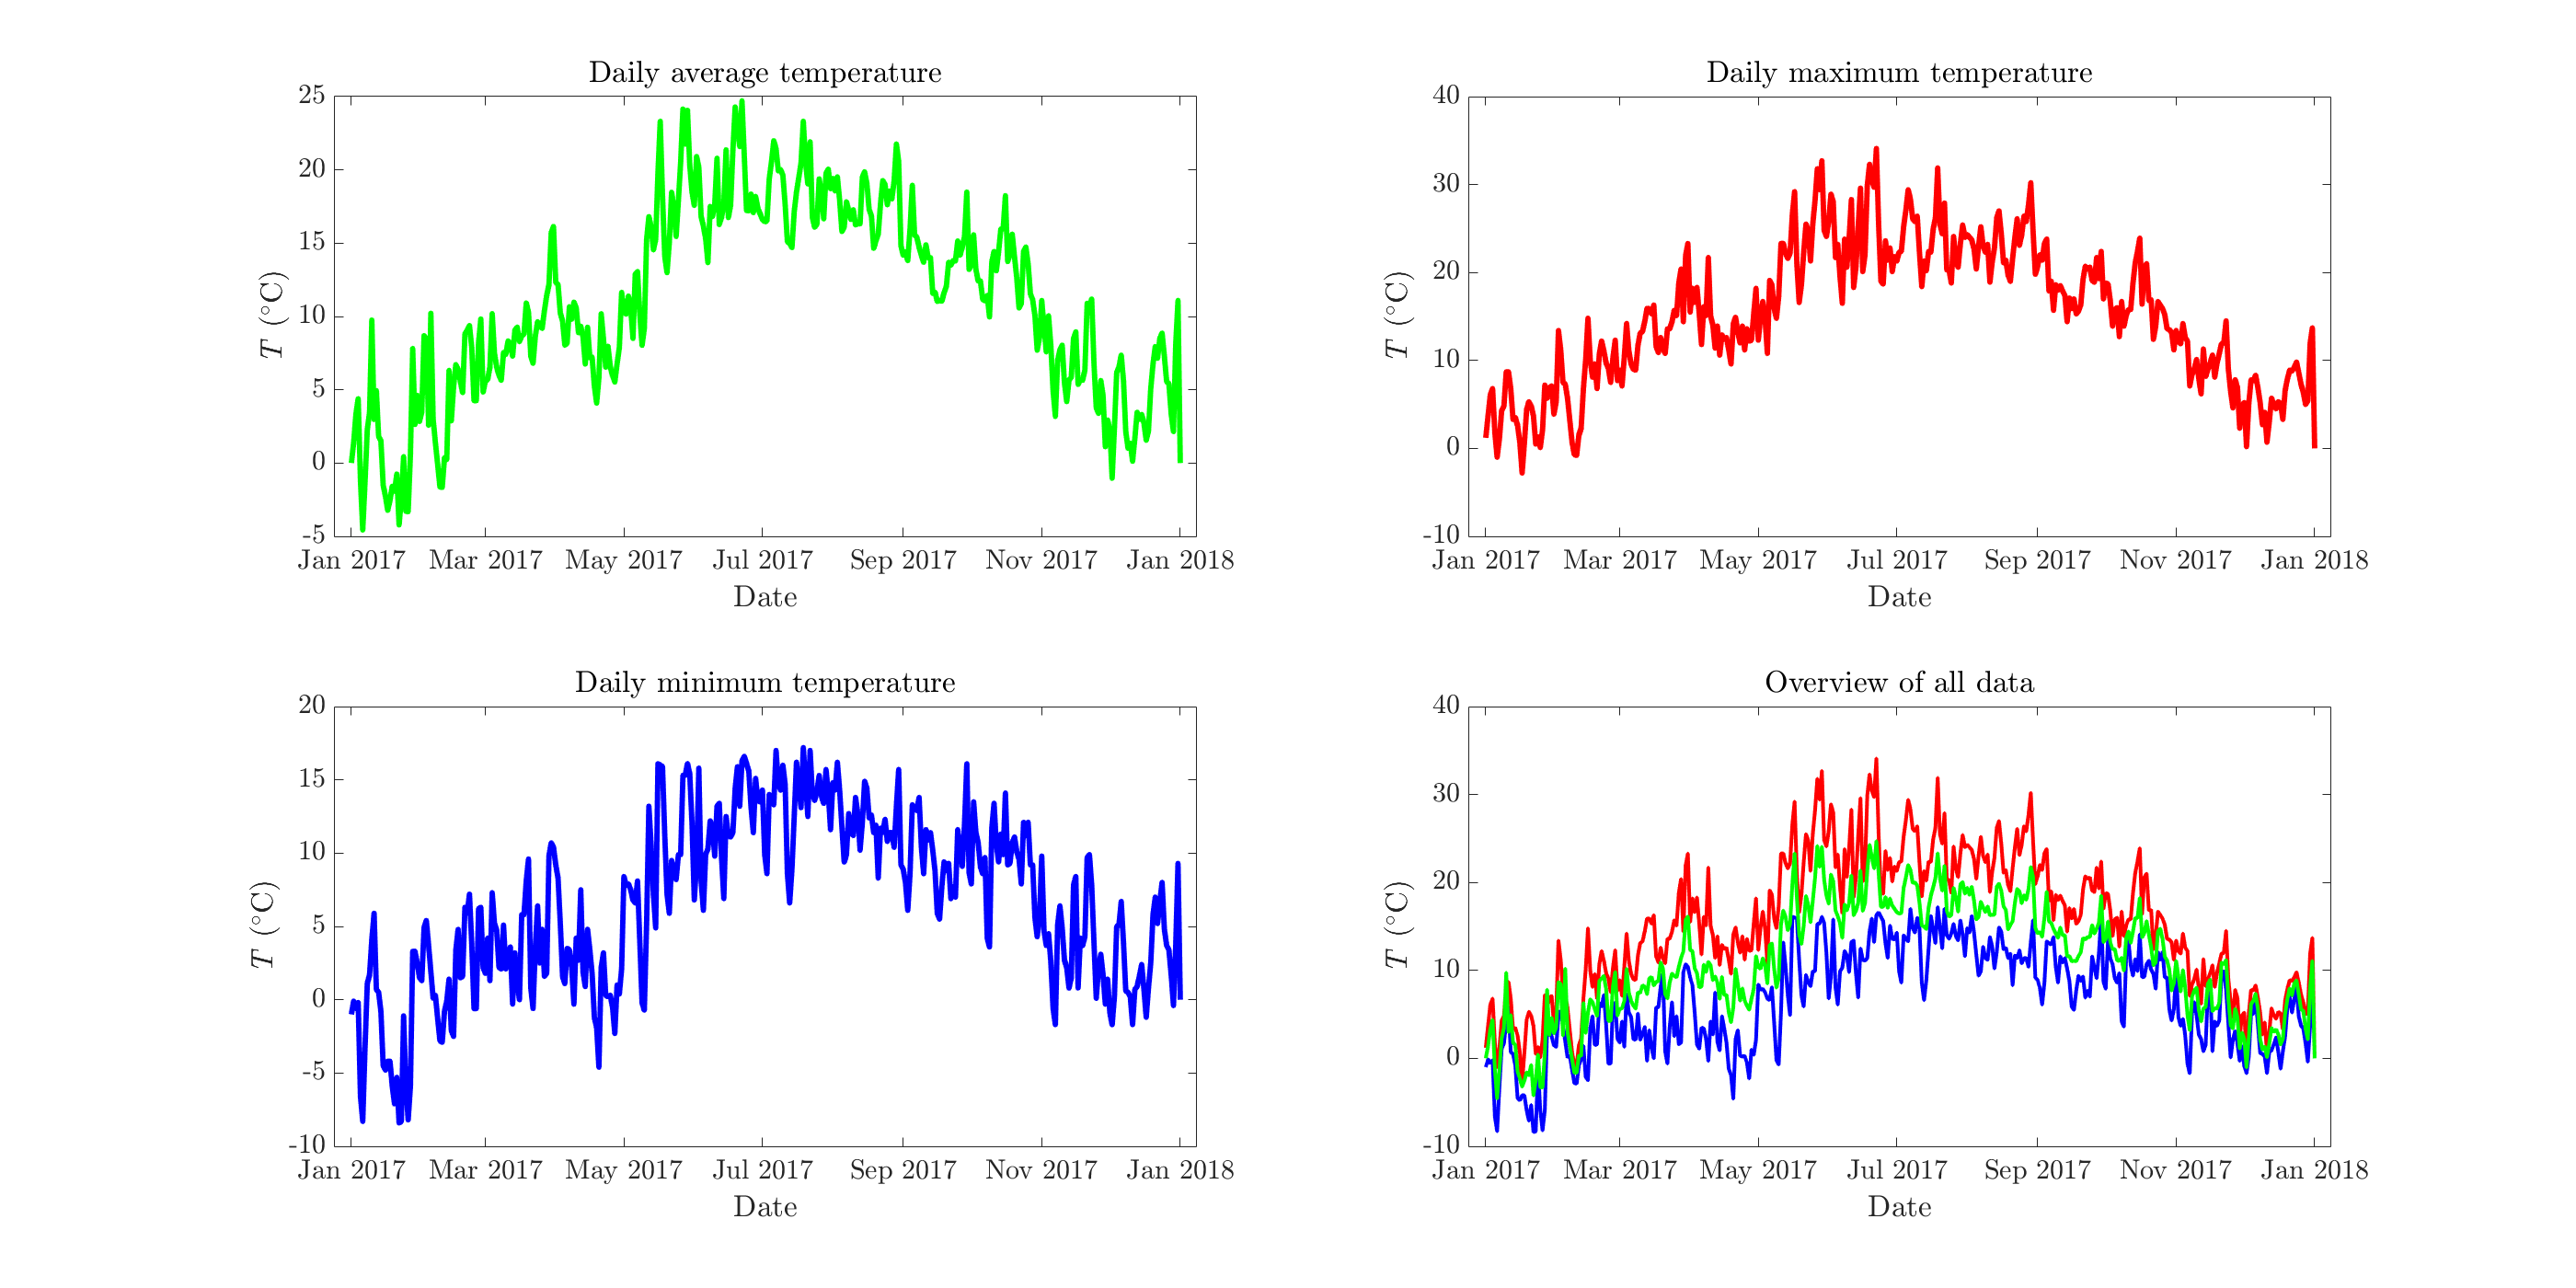
The obtained data is shown below in two different ways. Click on the images to obtain the full scale versions.
Extracting the minima and maxima is fairly straightforward. Extracting the average temperature required
more attention, as some data is missing (due to internet downtime). To compensate for these irregularities,
the daily temperature data has been integrated and divided by the elapsed time to obtain the true average.
While the line plots show the temperature distribution throughout the year on a daily scale, the 2D plots as
shown above show the weekly trend. The last figure (bottom right) is also interesting, as it shows that the
temperature can rise and drop within a day over quite large intervals.